
This page is the primary evidence behind The Need, which sets out the scale of the problem across police, fire, EMS and healthcare.
What a federal survey of more than 2,200 police officers found, and why it matters far beyond policing.
Officers did not describe themselves as anxious
They described themselves as calm. In 1984 the National Institute for Occupational Safety and Health surveyed patrol officers in 19 police departments across the United States. More than 2,200 officers returned completed forms. Asked about their own emotional state, most rated themselves highest on placidity, and the report notes “quite low levels of troubled conditions reflecting anxiety, depression or irritability.”
Then the researchers did something different. Instead of asking how officers felt, they counted how many measurable problems each factor was connected to: job-related attitudes, affective states, behavioral strains, somatic complaints, health disorders, and automobile accidents. Dozens of factors were tested, from shift work and pay to role conflict, union membership, boredom, court delays, and relations with citizens.
Anxiety connected to more of them than anything else measured. By nearly double.
Table 17, from the original report
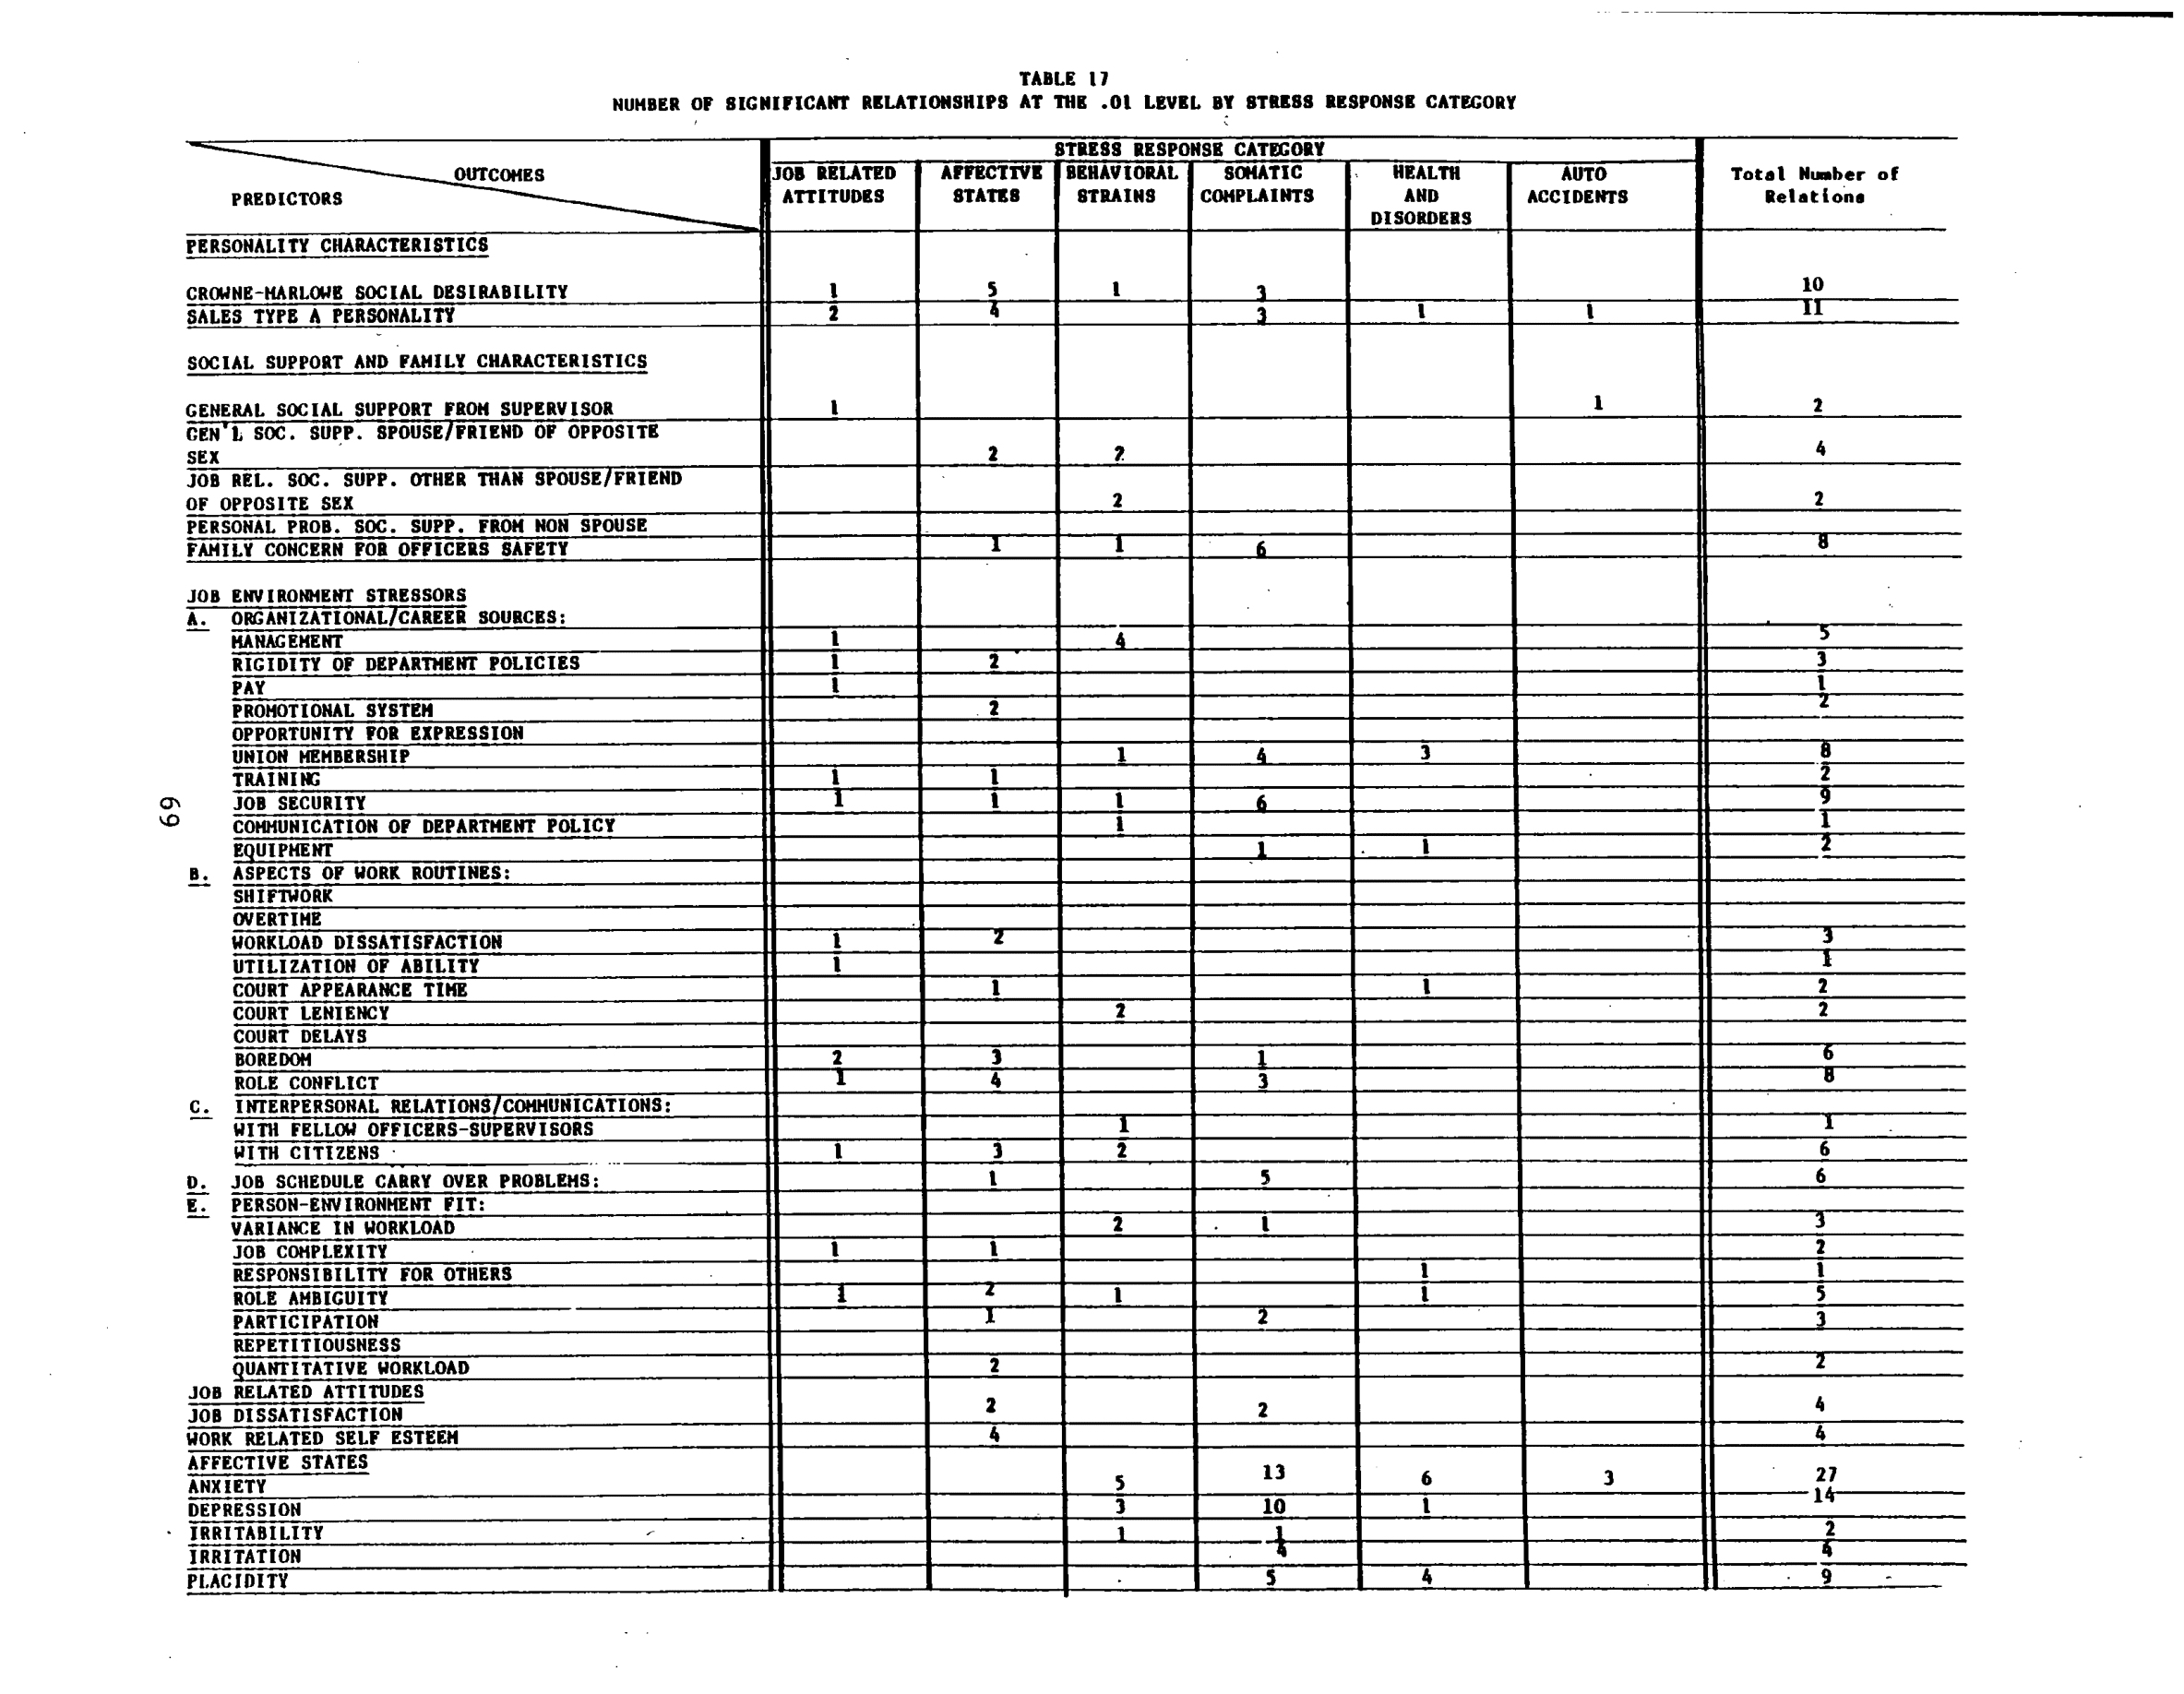
Read the bottom block, under AFFECTIVE STATES. The final column counts significant relationships at the .01 level.
| Behavioral strains | Somatic complaints | Health and disorders | Auto accidents | TOTAL | |
|---|---|---|---|---|---|
| Anxiety | 5 | 13 | 6 | 3 | 27 |
| Depression | 3 | 10 | 1 | 14 | |
| Placidity | 5 | 4 | 9 | ||
| Irritation | 4 | 4 | |||
| Irritability | 1 | 1 | 2 |
| Every other factor measured | Total |
|---|---|
| Sales Type A personality | 11 |
| Crowne-Marlowe social desirability | 10 |
| Job security | 9 |
| Family concern for officer's safety | 8 |
| Union membership | 8 |
| Role conflict | 8 |
| Boredom | 6 |
| Relations with citizens | 6 |
| Job schedule carry-over problems | 6 |
| Role ambiguity | 5 |
Not one other factor in the whole survey reached 15. Anxiety reached 27.
And nothing elsewhere in the table comes close. Type A personality reached 11. Social desirability 10. Job security 9. Union membership, role conflict, and family concern for an officer’s safety each reached 8. Boredom 6. Not one other factor in the entire study reached 15.
What this does and does not show
It shows correlation. It does not show that anxiety causes those problems, and this page will not claim that it does. What it establishes is something narrower and, for anyone responsible for a workforce, more useful: across an entire profession, anxiety is the single factor most consistently connected to behavioral problems, physical complaints, health disorders and accidents at once.
What the table identifies is the root under the symptom. What fifty years of my own work has produced is the antidote to that root. You do not need to settle causation to know where to aim. Anxiety is the highest-leverage target anyone has identified in this population, and it is the one that does not announce itself. The officers in that survey were not complaining of anxiety. They were reporting calm.
And what can be done about it
There is a measurable brain signal underneath the experience of anxiety. That is EEG Alpha activity. When Alpha is trained to go above a person’s own pre-training eyes-closed baseline, and to stay there for a sufficiently long period of time, anxiety drops. It drops reliably, it drops demonstrably, and it is now scientifically proven to drop.
Alpha up leads to anxiety down. Reliably. This is science. Brain science.
And in how many different ways does that help? Look again at Table 17 and count the columns anxiety touches. Behavioral strains. Somatic complaints. Health disorders. Auto accidents. Every one of those is a category where the most connected factor is the one we know how to train.
Whom does this exclude?
The survey studied police officers, and it speaks only about police officers. It did not study your hospital, your fire service, your dispatch floor or your operating theatre.
But there is nothing about anxiety that is specific to a badge. Firefighters, paramedics, emergency physicians, intensive care nurses, air traffic controllers, dispatchers and the supervisors responsible for all of them carry the same load. That extension is an inference, not a finding, and it is offered here as a question rather than a conclusion. It is a question worth asking about your own people.
Why I have spent fifty years on this
Because anxiety turned out to be measurable, and then it turned out to be trainable.
In 1978 Joe Kamiya and I published in Science what happened when we screened one hundred college men on the MMPI and gave the highest and lowest scorers seven consecutive days of alpha brainwave feedback. Anxiety fell in the high-anxiety group and not in the low one. The result held after correcting for regression to the mean, and it held on a second anxiety scale.
Since then the same finding has recurred in other populations. In a 2012 study published in Advances in Mind-Body Medicine, anxiety fell with a significance of p = .005.
When Alpha EEG activity is trained up, anxiety goes down. Reliably, and documented and confirmed in scientific publications in main line journals. That holds for both State Anxiety, which is how you feel today, and Trait Anxiety, which is the level you carry through your life. The short version, which I wrote into a federal grant application in 1995: high anxiety people who achieve sufficient increases in their EEG Alpha power become low anxiety people.
The study that still has not been done
In 1995 I applied to the National Institute of Justice to close the loop: 200 officers of a large urban police department measured, 100 of them trained, with follow-up at four, eight and twelve months. The application carried letters of support from a serving police chief, a former chief of police who had taken the training himself, and the chair of the California Legislative Assembly’s budget committee.
That study has still not been done, by anyone. The correlation has been sitting in a federal report since 1984, the method has been in the literature since 1978, and no one has put the two together at scale in a police department.
If you carry responsibility for people who work under load, and you want to talk about what measurement can show you, start a conversation here.
Source. Hurrell, J.J., Jr., Pate, A., & Kliesmet, R. Stress Among Police Officers. U.S. Department of Health and Human Services, Public Health Service, Centers for Disease Control, National Institute for Occupational Safety and Health, Publication 84-108. Cincinnati, Ohio, October 1984. Table 17 appears on page 69. The overall questionnaire response rate was 37 per cent. NIOSH publications are works of the United States federal government and are in the public domain.
